Introduction:
- The world of Forex trading is dynamic and fast-paced, with traders constantly seeking effective tools to navigate the complexities of the market. Among the many tools available, candlestick charts have emerged as a popular choice for Forex traders. These visual representations of price movements offer unique insights into market trends and have become an essential part of technical analysis. In this blog, we will delve into the significance of candlesticks, exploring their definitions, advantages, and key takeaways for traders.
Candlestick Charts:
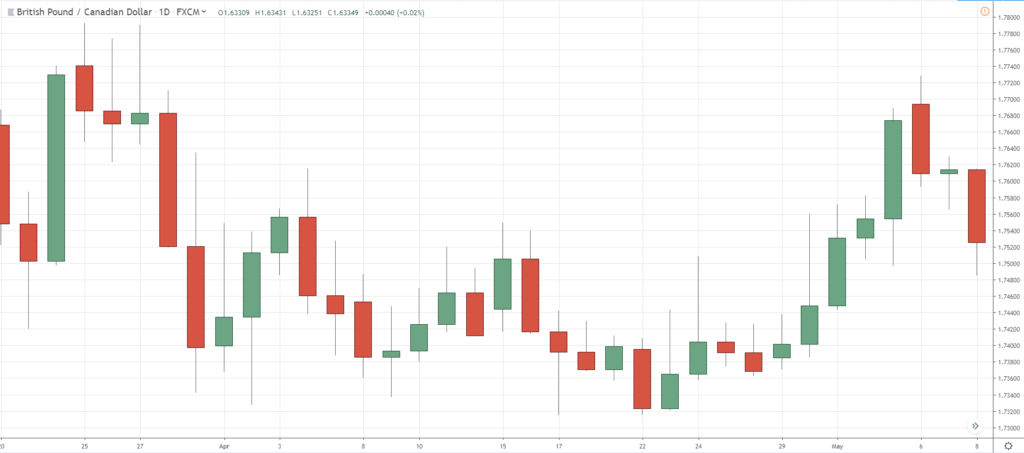
- Candlestick charts, developed centuries ago in Japan, have gained widespread adoption in the financial markets, including Forex. These charts provide a graphical representation of price movements over a specific time frame. Each candlestick consists of a body and wicks, representing the opening, closing, high, and low prices during the chosen period. The color of the candlestick—typically green or red—indicates whether the closing price was higher or lower than the opening price.
Candlestick Definitions:
- Understanding the basic candlestick patterns is crucial for interpreting market sentiment and making informed trading decisions. Some fundamental candlestick patterns include:
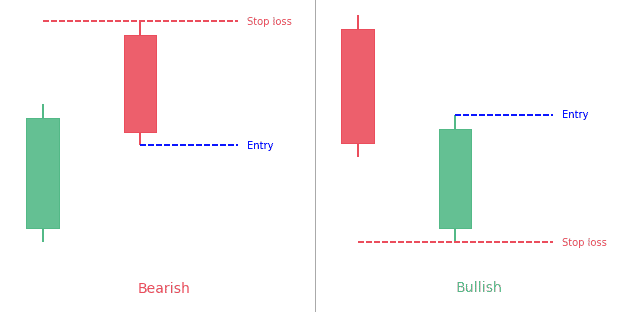
1. Bearish Engulfing
- The opposite of the bullish engulfing pattern, indicating a potential reversal to the downside.
2. Bullish Engulfing
- A bullish reversal pattern where a small bearish candle is followed by a larger bullish candle, engulfing the previous one.
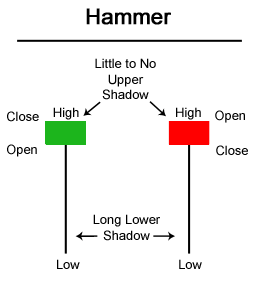
3. Hammer
- A bullish reversal pattern characterized by a small body and a long lower wick, signaling a potential upward reversal.
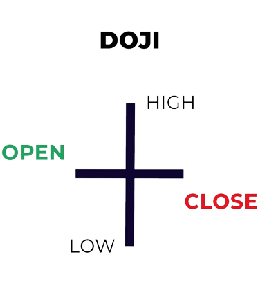
4. Doji
- A candlestick with an opening and closing price that are nearly the same, suggesting indecision in the market.
Advantages of Candlestick Charts:
1. Visual Representation
- Candlestick charts provide a clear visual representation of price movements, making it easier for traders to interpret market trends and patterns.
2. Pattern Recognition
- Traders can identify various candlestick patterns that signal potential trend reversals or continuations, helping them make timely decisions.
3. Market Sentiment
- The color and size of candlesticks convey valuable information about market sentiment, allowing traders to gauge the balance between buyers and sellers.
4. Effective for Short-Term Trading
- Candlestick charts are particularly useful for short-term traders, as they provide insights into intraday price movements.
Key Takeaways
1. Pattern Recognition is Key
- Mastering candlestick patterns is crucial for successful Forex trading. Recognizing patterns like engulfing, doji, and hammers can provide valuable insights into market dynamics.
2. Combine with Other Indicators
- While candlestick charts are powerful on their own, combining them with other technical indicators can enhance their effectiveness. Traders often use moving averages, RSI, or MACD alongside candlestick analysis for a comprehensive approach.
3. Stay Informed About News Events
- External factors, such as economic releases and geopolitical events, can impact currency prices. Being aware of the economic calendar and news events is essential for successful trading.
4. Risk Management is Paramount
- Even with the insights gained from candlestick analysis, risk management remains crucial. Setting stop-loss orders and managing leverage are vital components of a successful trading strategy.


