- In the vast landscape of financial markets, Forex trading stands out as one of the most dynamic and intriguing arenas. Unlike other markets, Forex operates 24 hours a day, five days a week, making it accessible to traders from around the globe. But amidst its accessibility and potential for profit lies a complex network of factors influencing currency prices. To navigate this landscape successfully, traders often turn to technical analysis, a method that relies on historical price data to forecast future price movements. Within technical analysis, certain patterns emerge as reliable indicators, providing valuable insights for traders. Here, we delve into some common technical analysis patterns every Forex trader should know.
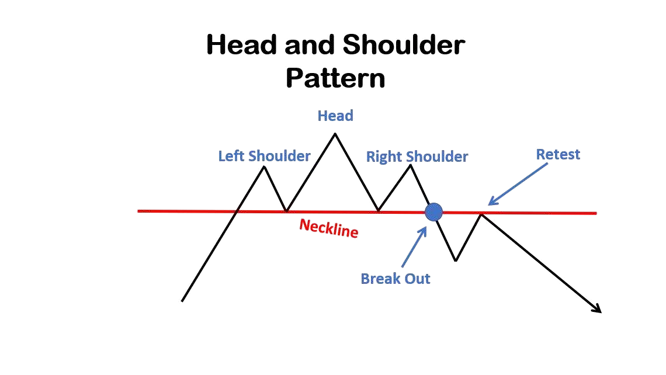
1. Head and Shoulders Pattern
- This classic pattern is widely regarded as a reliable indicator of trend reversal. It consists of three peaks: a higher peak (the head) flanked by two lower peaks (the shoulders). The neckline, formed by connecting the lows between the peaks, serves as a critical level. When the price breaks below the neckline after the formation of the right shoulder, it signals a potential downward trend reversal.

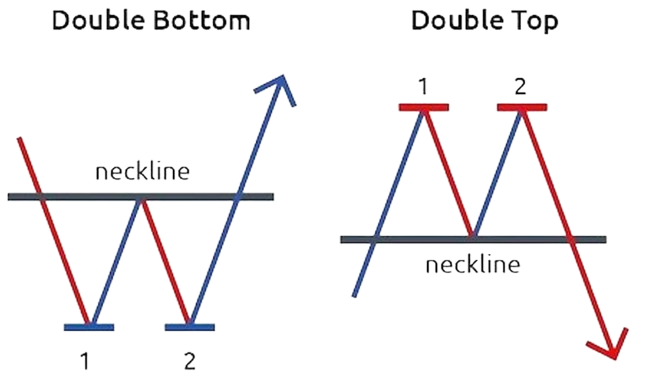
2. Double Top and Double Bottom
- These patterns occur when the price reaches a high or low twice, but fails to break through, forming a distinct pattern resembling the letter "M" (for double top) or "W" (for double bottom). Double tops indicate a potential reversal from an uptrend to a downtrend, while double bottoms suggest a reversal from a downtrend to an uptrend. Traders often look for confirmation signals such as volume spikes or breakouts to validate these patterns.

3. Flags and Pennants
- Flags and pennants are continuation patterns that occur after a strong price movement, indicating a brief consolidation before the trend resumes. Flags are characterized by parallel trendlines, while pennants form triangular patterns. Traders typically enter positions in the direction of the preceding trend once the price breaks out of the flag or pennant formation.

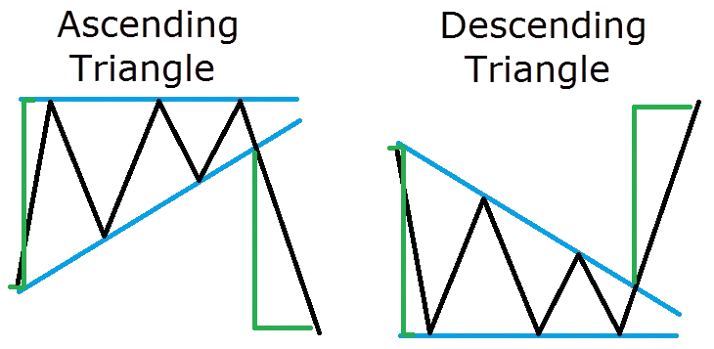
4. Ascending and Descending Triangles
- These patterns form when the price consolidates within converging trendlines, with ascending triangles having a flat top and rising bottom trendline, and descending triangles featuring a flat bottom and descending top trendline. Ascending triangles are bullish patterns, suggesting an eventual breakout to the upside, while descending triangles are bearish, indicating a potential downside breakout.

5. Bullish and Bearish Divergence
- Divergence occurs when the price movement diverges from the movement of an oscillator indicator such as the Relative Strength Index (RSI) or Moving Average Convergence Divergence (MACD). Bullish divergence occurs when the price makes lower lows while the oscillator makes higher lows, signaling potential bullish momentum. Conversely, bearish divergence occurs when the price makes higher highs while the oscillator makes lower highs, suggesting potential bearish momentum.

Key Takeaways
- 1. Technical analysis patterns provide valuable insights into potential price movements in the Forex market.
- 2. Understanding these patterns can help traders identify entry and exit points, manage risk, and make informed trading decisions.
- 3. It's essential for traders to combine technical analysis with other forms of analysis, such as fundamental analysis and market sentiment, for a comprehensive understanding of market dynamics.
- 4. Successful trading requires discipline, patience, and continuous learning. Traders should test and refine their strategies, adapt to changing market conditions, and always prioritize risk management.


